BTree arity continued
2014-06-06
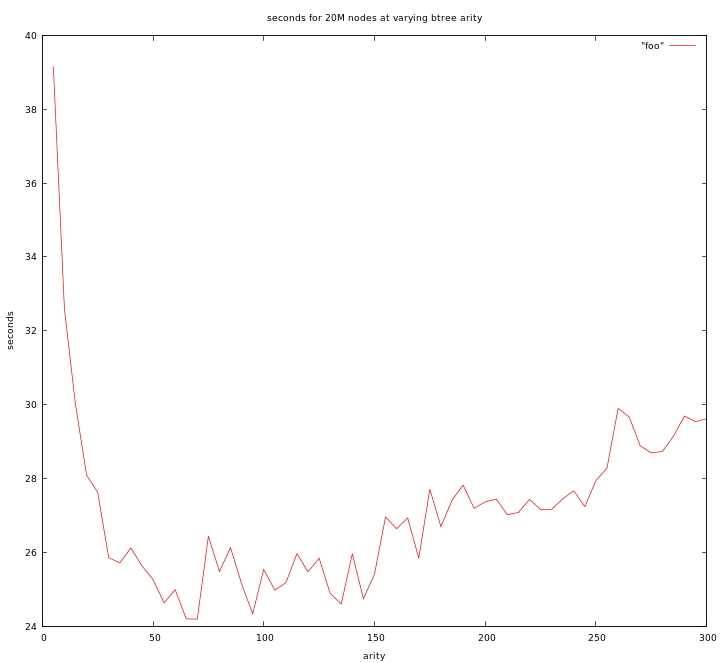
Remember our graph from last time. This is the time taken for 20 million random elements to be inserted and removed at each arity, in a tree of simple integers.
I got curious and wanted to see what this looked like if you use the tree as an actual dictionary structure. This stores a std::pair

This test was done on the same machine as before, a Intel(R) Core(TM) i7-4500U CPU @ 1.80GHz, ubuntu desktop, gcc 4-8-1-10ubuntu9. Linux kernel 3-11.0-19-generic. Note further that it has 8GB of ram, 64 byte cachelines, and 128k of L1 cache.
So what conclusions can we draw from this? Honestly, I'm really not sure. But, I will make some educated guesses
First of all lets talk about what we're changing. As we walk down the tree we are in effect doing a binary search. Similarly as we search for an element within the node we are also doing a binary search. So, changing arity doesn't change the search at all.
There are two properties that should change. first is caching effects: We get better locality when we don't have to switch nodes as often. Second is the linear moving of data, as nodes get bigger inserts and removals into a node, as well as splits and joins, require more and more shifting of the elements. So our graph should be a graph of these two competing properties, caching gets better as nodes increase in size, but that linear copy cost increases as well. Note that when we do shifts and splits it is not only the array of data, but also the array of pointers to child nodes that has to be shifted. I actually just realized I could probably speed up my tree by not doing this move on leaf nodes, but we do it in the tests shown here.
So, on the left side where the latency drops precipitiously we're getting very clear caching wins. Within a cacheline or two the shifting has basically no cost. One or two cycles to move an element is nothing compared to a cache miss. Then we kindof hit the bottom. Note that it starts to level out at about 25 elements. For the first graph it levels out at about 55 elements. Both occur where the node is about 200 bytes in size, or about 4 cachelines. It's no-where near L1 cache-size when it levels out, so it can't be that it levels out due to L1 cache-size. It must be something else. The additional cost of shifting alone (ignoring caching) is perfectly linear, so it can't explain an elbow like that. My guess is actually that it's related to the non-locality of binary search, as we make it larger at this point we're not getting appreciably fewer cache-misses because since we split off an average of a quarter of the array each time, chances our that past this point our first cache-miss (and cache-line load) will never get another hit inside of it. I'm sure there's some complex math that explains why this is an inflection point, but you can see why something is qualitatively different as you cross that size boundary.
The right side starts to climb again at about 90 elements in one case and 180 in the other... or ~720 bytes. This is around 12 cachelines in size. I have no idea why this inflection point occurs. It's a much weaker inflection so it seems likely that it really is just the linear effects finally overriding caching benifits. That's the best I can guess right now.
In any case... I thought it was neat that storing pairs didn't cost us *that* much in speed compared to storing sets, and that due to the inflection points being in nearly the same places when measured by bytes per node we can demonstrate that what we're seeing are almost certainly caching related effects.
Again all tests are on github.